Tensorflow is a high performance numerical computation software library, it is mostly known for its strong support for machine learning and deep learning.
How to Install
If you have ‘pip’, everything is simple
pip install tensorflow
Basic Concepts
Graph
Graph is a fundamental concept in Tensorflow. Take ReLU computation as an example, the function of ReLU is
h=ReLU(Wx+b)
In the view of Tensorflow, the function looks like this
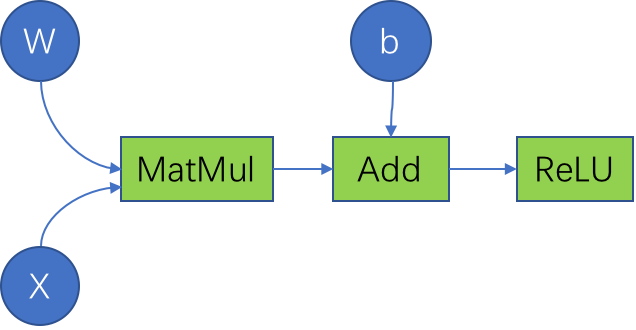
Nodes
Variables such as W and b , placeholders such as x, are operations such as MatMul, Add are all nodes in the graph.
Edges
The edges between nodes indicate the data which flow between nodes, in tensorflow data is represented as “tensor” .
“tensor” + “flow” = “tensorflow”
Codes
import tensorflow as tf
import numpy as np

if __name__ == '__main__':

	b = tf.Variable(tf.zeros((10,)))
	W = tf.Variable(tf.random_uniform((20, 10), -1, 1))

	x = tf.placeholder(tf.float32, (10, 20))

	h = tf.nn.relu(tf.matmul(x, W) + b)

	writer = tf.summary.FileWriter('./graphs', tf.get_default_graph())

	with tf.Session() as sess:
		sess.run(tf.global_variables_initializer())
		sess.run(h, {x: np.random.random((10, 20))})

	writer.close()
Here are the steps described in the above codes.
- Create a graph using Variables and placeholders.
- Start a tensorflow session and deploy the graph into the session.
- Run the session, let the tensors flow.
- Write processing logs using tools such as tf.summary.
Session is the so called execution environment. It needs two parameters which are “Fetches” and “Feeds”.
sess.run(fetches, feeds)
Fetches: List of graph nodes
Feeds: Dictionary mapping from graph nodes to concrete values.
In the ReLU example, Fetches = h = tf.nn.relu(tf.matmul(x, W) + b) , Feeds = {x: np.random.random((10, 20))}
It would be interesting to see what happened during the running time. We can try TensorBoard.
TensorBoard Result
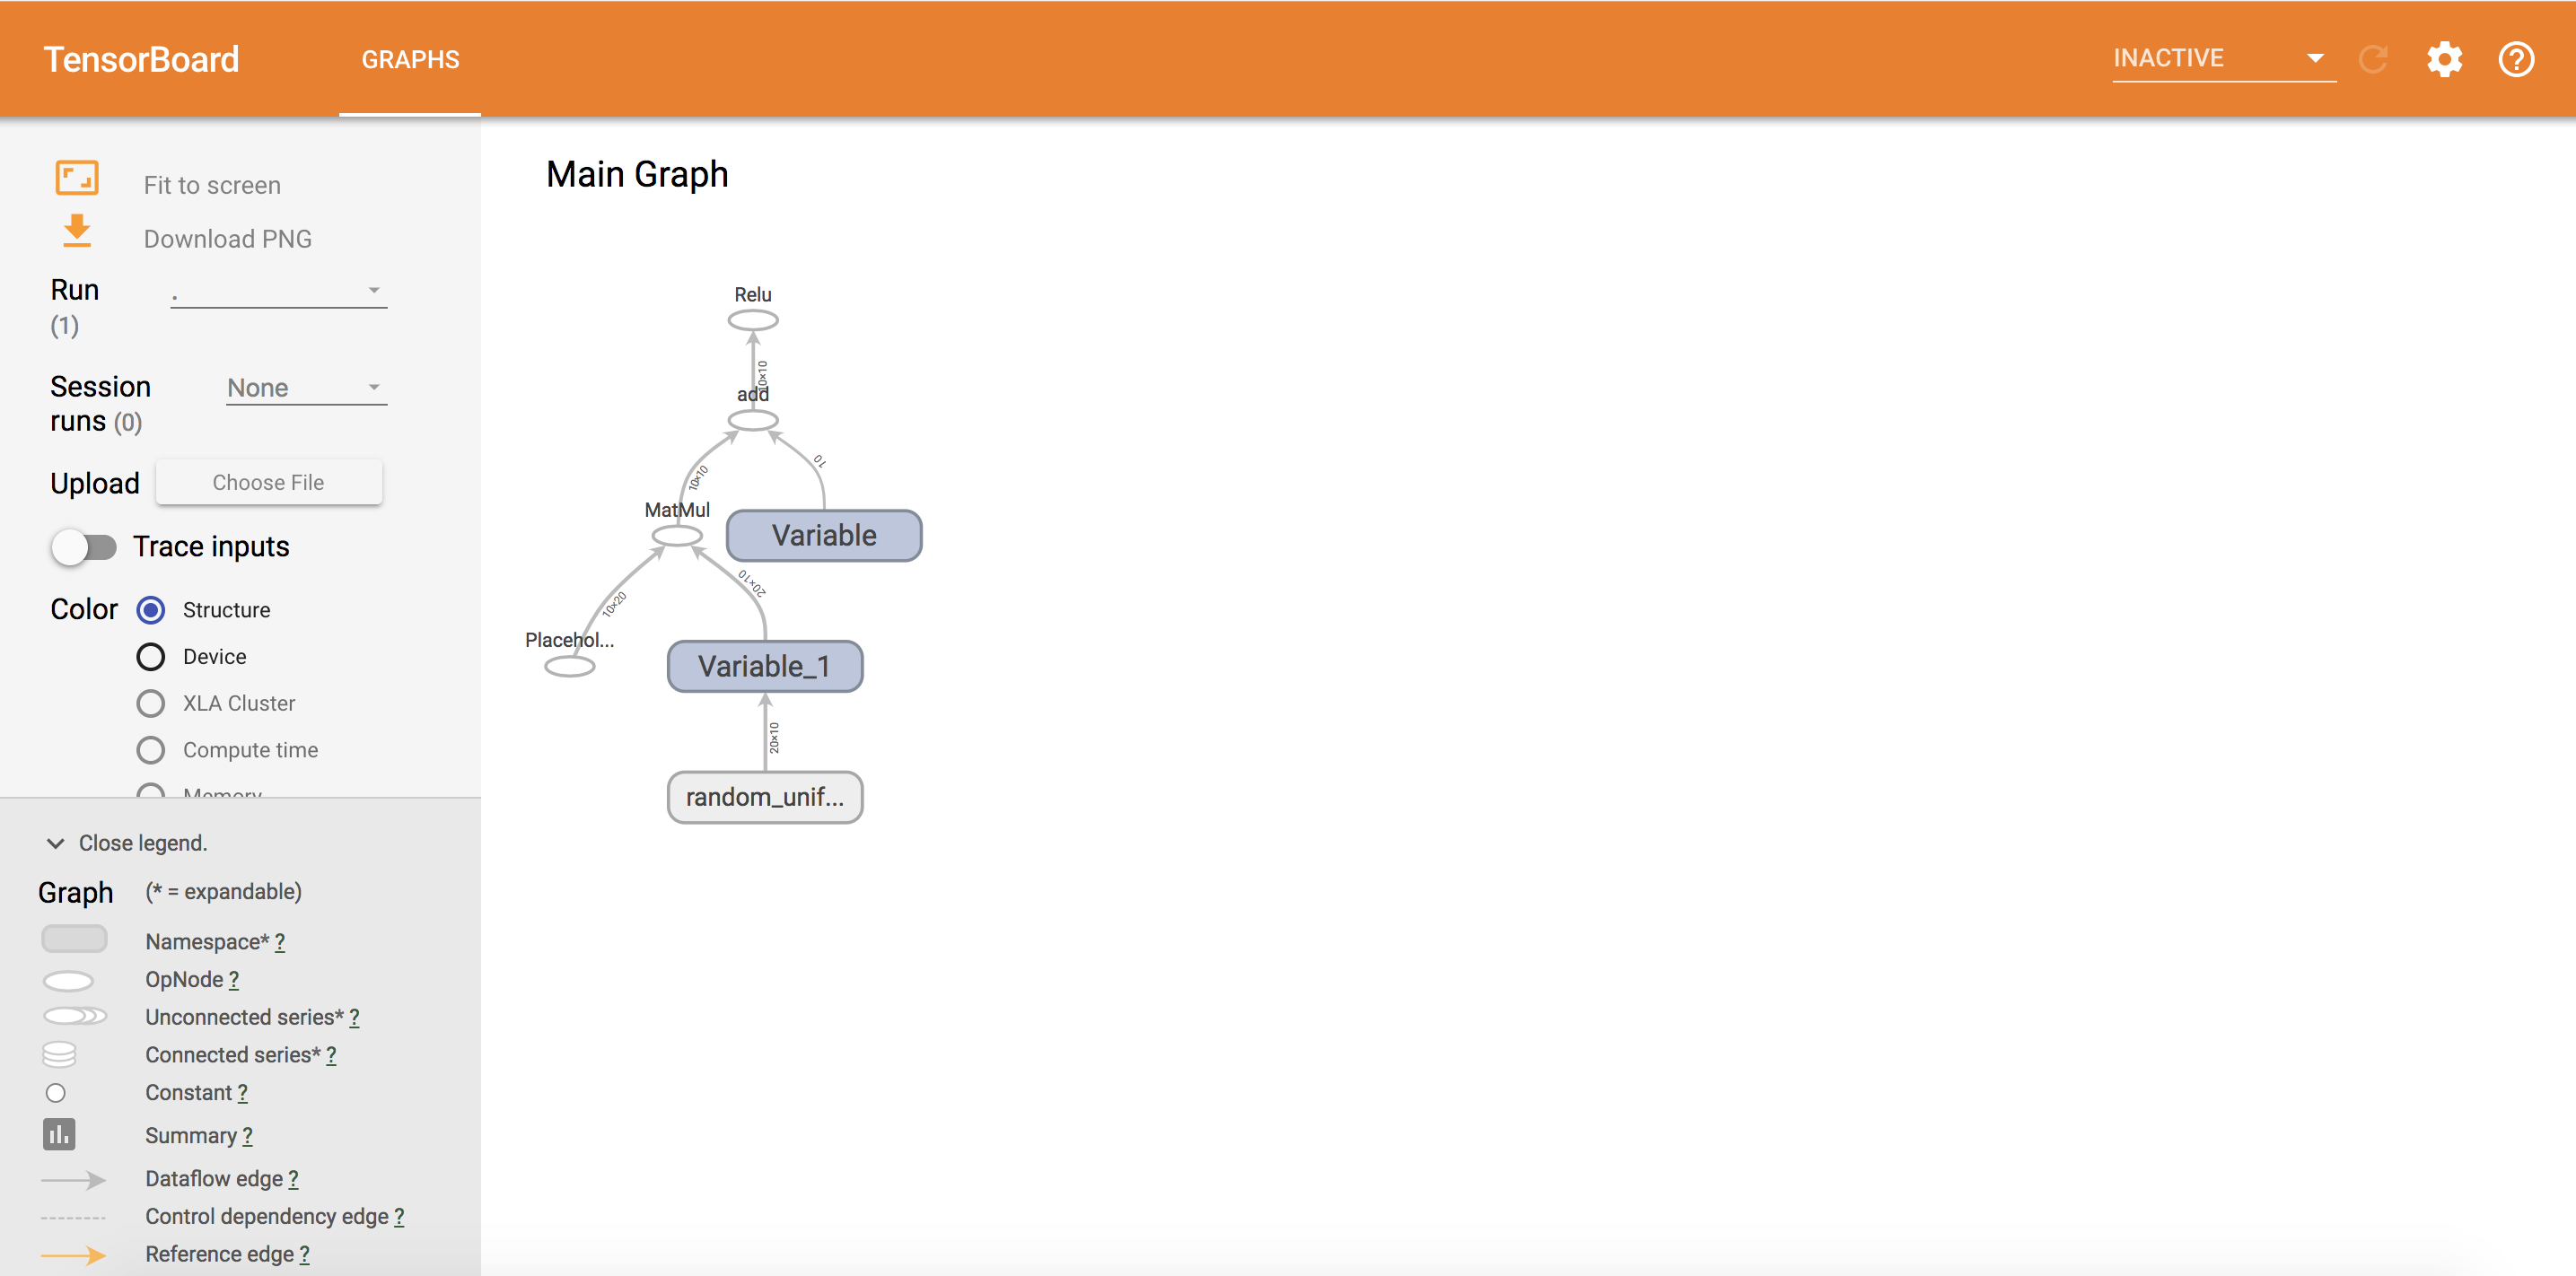
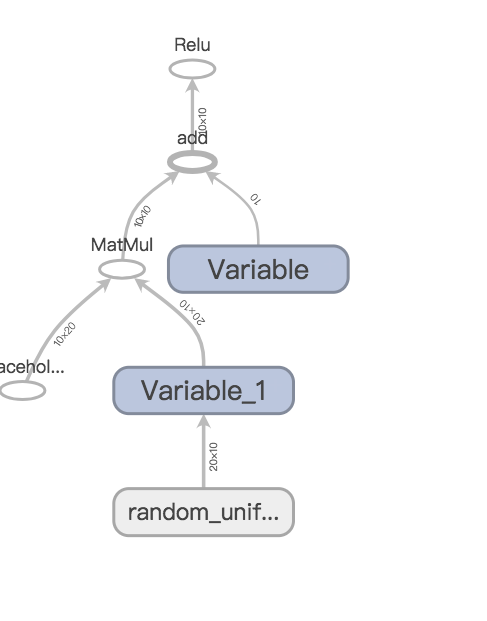
The Main Graph clearly shows how the tensor flows through the graph. In a complex machine learning program, the printed diagram is a convenient tool to increase the confidence of the result.